Measuring T-States
Klive makes it easy to measure the number of T-states (clock cycles) that a piece of code consumes. When you open the CPU panel, it displays a value, TSP, which stands for T-states elapsed since the last pause. Whenever your paused machine continues the code execution (debugging), the next time it gets paused, this value displays the number of T-states used since the last pause.
Example
Take a look at the following code (use the ZX Spectrum 48K model):
Start:
.model Spectrum48
.org #8000
ld a,2; ; (START)
call #1601 ; open the channel
ld hl,Message ; HL points the the message string
NextCh:
ld a,(hl) ; get next character
or a
jr z,Done ; we reached the end
rst #10 ; display character
inc hl ; next character
jr NextCh ; next loop
Done:
jp #12a9 ; (END)
Message:
.dm "\a\x0A\x06" ; AT 10, 6
.dm "\p\x04" ; PAPER 4
.dm "Welcome to Klive IDE"
.dm "\a\x0B\x08" ; AT 10, 8
.dm "\p\x04" ; PAPER 4
.dm "\b\x01" ; BRIGH 1
.dm "(ZX Spectrum 48)"
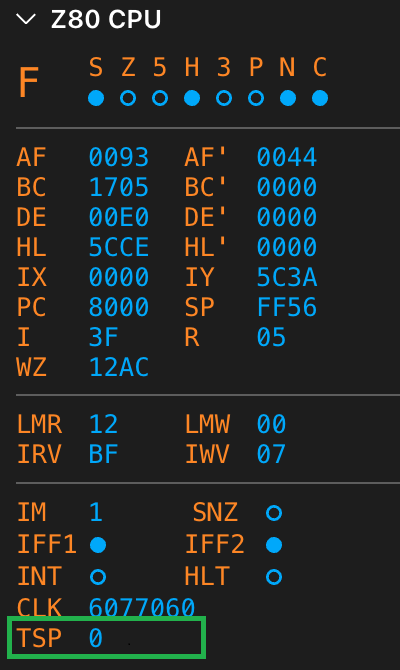
.db 0x00 ; terminateAdd two breakpoints to the lines marked with (START) and (END). Now, run the code in the debugger. When the code execution stops at the first breakpoint, (START), check TSP at the CPU panel:
Click continue and let your code access the second breakpoint, (END). The TSP value shows the number of T-states that have elapsed since continuing from (START):
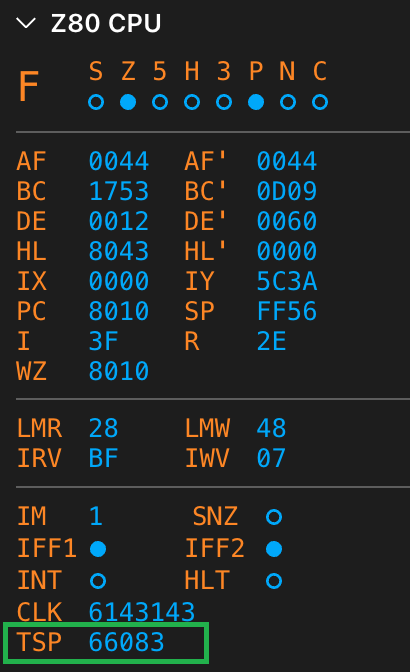
Now you can see how many T-states your code consumes between two breakpoints. This feature is handy when you want to optimize your code for speed.
Conditions Influencing T-States
There are some things you should consider when measuring the number of T-States:
1. Memory contention
The ZX Spectrum 48K model’s CPU and ULA contend for memory access to the $4000-$7fff address range when reading or writing information. The ULA may block the CPU for a few states. So, when your code runs, it may display a bit different TSP values for each run due to memory contention.
2. Interrupts
If your code takes more than 20 milliseconds to run, an interrupt request is likely. In this case, the interrupt handler’s T-states are also summed up to the TSP value.