The Disassembly View
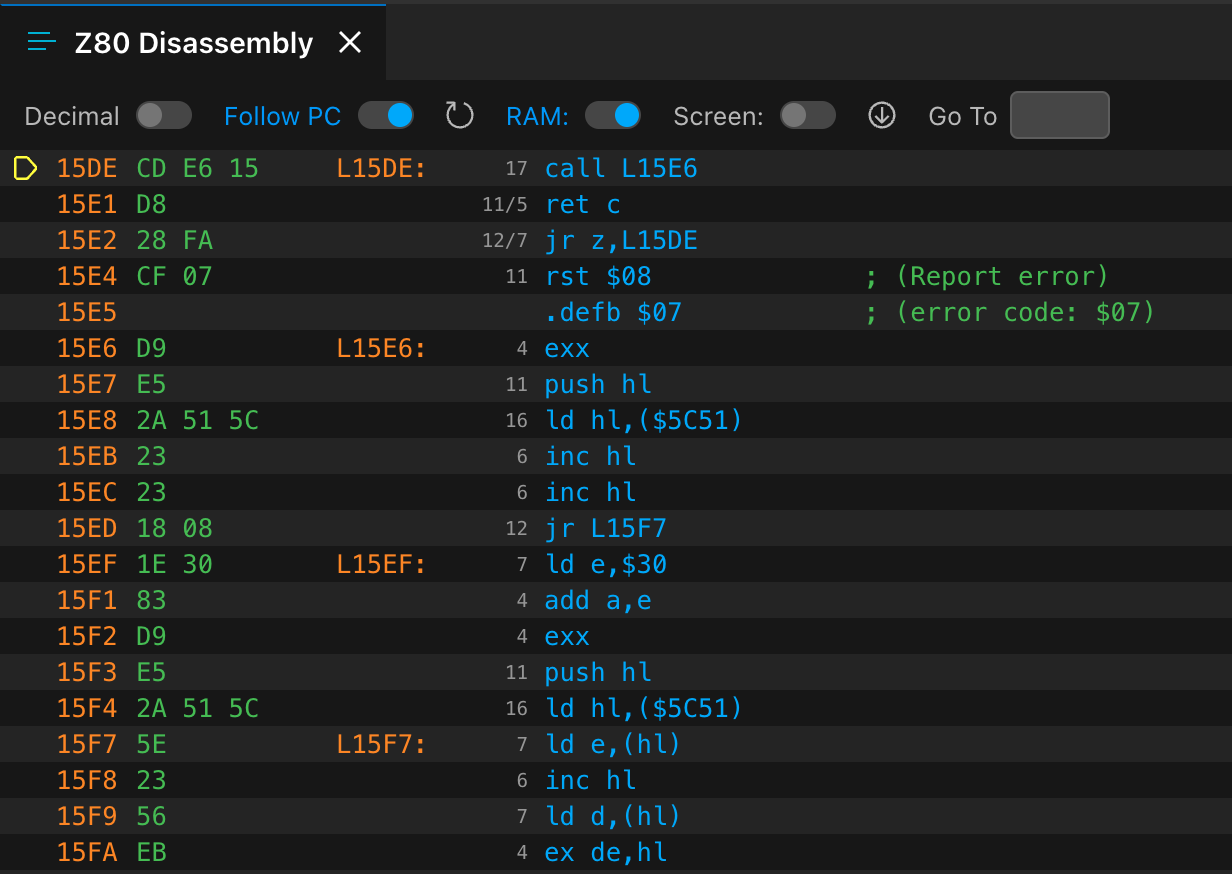
You can view the disassembly of the memory with the IDE | Show Disassembly menu command:
Besides viewing the disassembly, you can add breakpoints by clicking with the right mouse button to the left of the line address (see address line 0007):
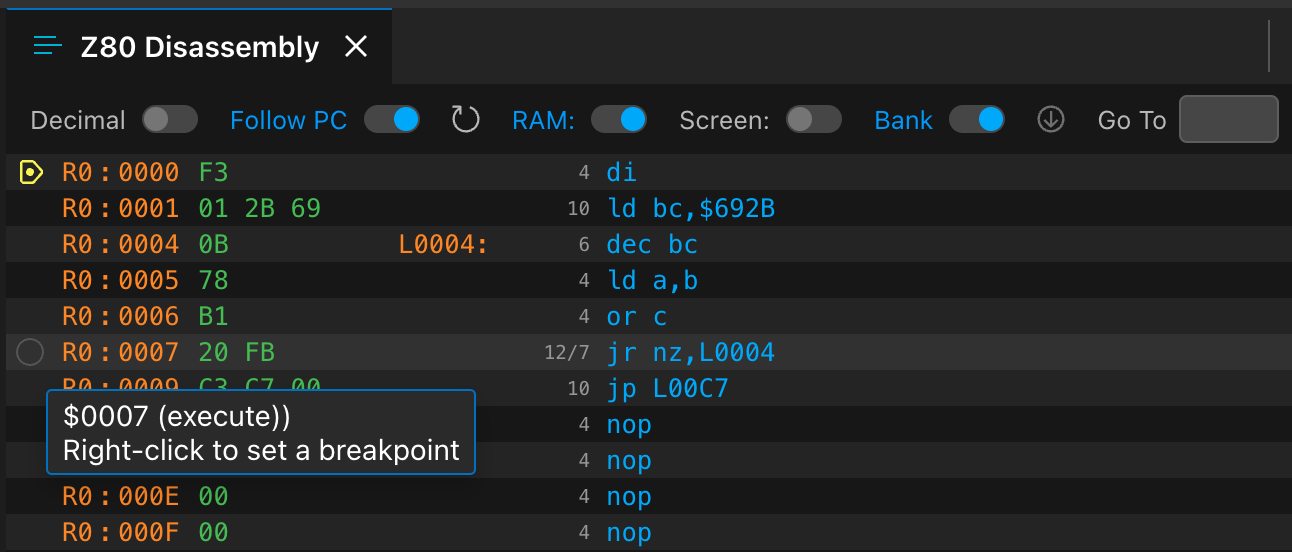
When you click an existing breakpoint with the right mouse button, the IDE removes it.
Currently, you can only add execution breakpoints to the Disassembly view. With interactive commands (see the ones starting with bp-), you can create memory and I/O operations breakpoints.
By default, when you display the disassembly, it uses the current value of the PC (Program Counter) register and disassembles up to 1024 bytes of code.
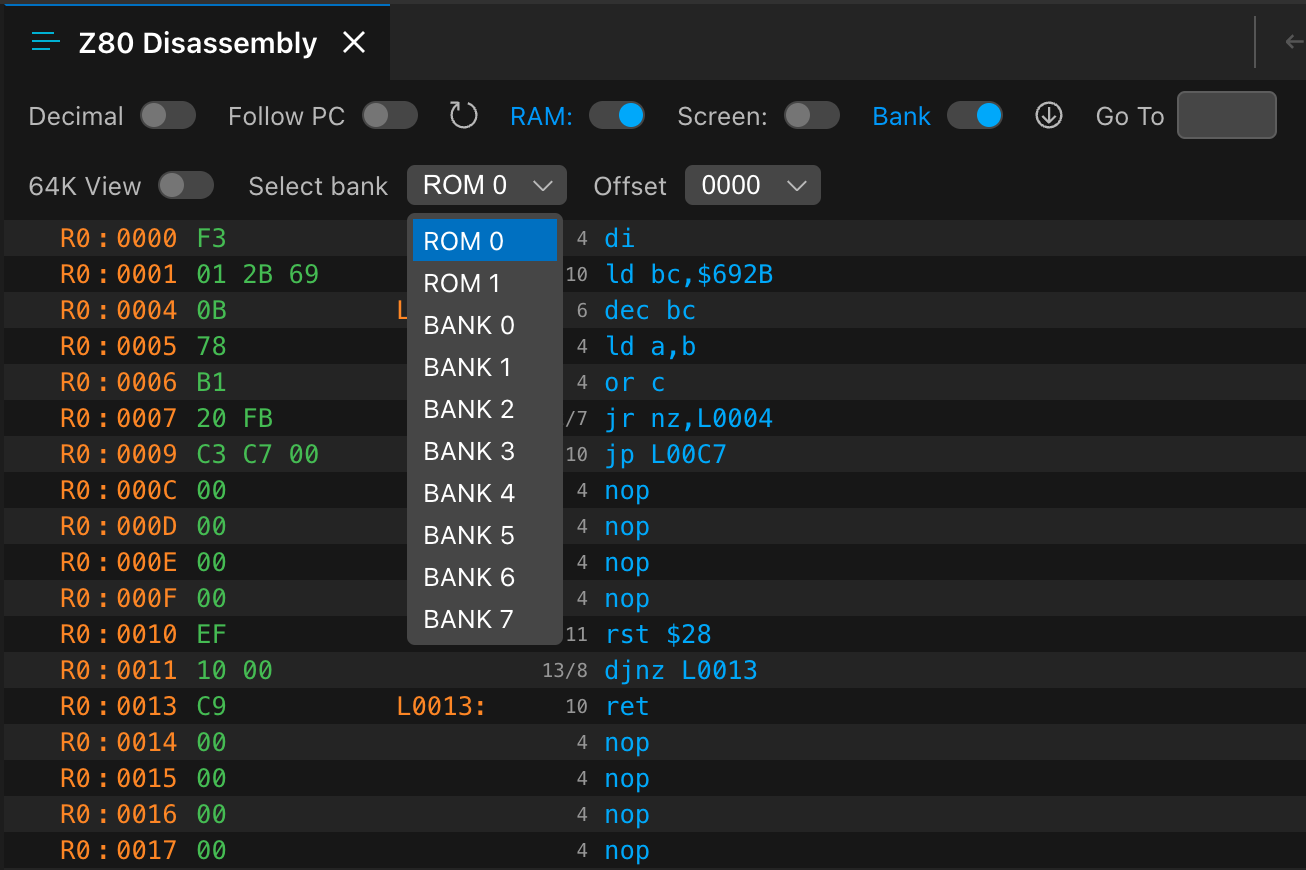
Turn off the Follow PC option to disassemble the entire memory (or a selected bank). With this option turned off, models supporting memory paging display a second row of options:
Display Options
The Disassembly View provides a few options to display and navigate the memory contents:
- Decimal: Turns on or off the decimal display (off, by default). When turned off, memory addresses, opcodes, and instructions are displayed with decimal numbers; otherwise, they are hexadecimal.
- Sys vars: Names 16-bit data addresses after the machine’s system variables (on, by default). See System Variable Names below.
- Ram: This option (on, by default) allows you to disassemble the RAM’s contents.
- Screen: This option (off, by default) lets you disassemble the screen memory’s ($4000-$5AFF) contents.
- Bank: This option (on, by default) allows you to turn the display of bank labels on or off in front of memory addresses. This option is available only for models that support memory paging.
- Go To: Type an address into this box and press Enter to jump to the particular address. If the particular address is not at a disassembled instruction’s boundary, it will settle at the next instruction. In decimal mode, you can type decimal addresses; otherwise, use hexadecimal addresses.
A little icon (up or down arrow) is before the Go To address box. Unless the machine is paused, this icon is disabled. When the machine is in a paused state, clicking the button jumps to the disassembly at the address pointed by the PC. The direction of the arrow indicates where the PC position can be found relative to the current view.
System Variable Names
Wherever an instruction loads or stores through a literal 16-bit address, and that address is one of the machine’s system variables, the view prints the variable’s name instead of the number:
ld hl,LAST_K
ld (ERR_NR),a
ld sp,RAMTOP
ld (CHANS),hl
The names come from the same table the System Variables panel lists, so each machine
contributes its own — the ZX Spectrum 48K, 128K and +3, and the ZX Spectrum Next each have one.
Names are spelled so an assembler would accept them: the ROM manuals print several with a space or a
hyphen (ATTR P, CH-ADD), and every character that is not a letter, a digit or an underscore
becomes _ — so those read ATTR_P and CH_ADD.
Only data operands are named — the 16-bit loads and stores. JP and CALL targets keep their
L-prefixed labels, because the system variable area is not code: an address there matching a jump
target is a coincidence far more often than a fact worth printing. Naming applies to the Z80 and
Z80N machines; the Commodore 64’s 6510 listing shows its addresses unchanged.
The Sys vars switch turns the naming off and on. It is on by default, each view remembers its own setting, and turning it off shows the addresses exactly as they were before.
The same naming appears in the disassembly of a popped-out .NEX bank, with its own Sys vars
switch. There, a label you wrote yourself always wins: your label says something about this
program, while a system variable name only states a fact about the machine.
Branch Verdicts
While a machine is running or paused, the Disassembly View marks every conditional branch it can see with what that branch will do next, worked out from the CPU’s current flags and registers. A narrow column between the T-states and the instruction carries the mark:
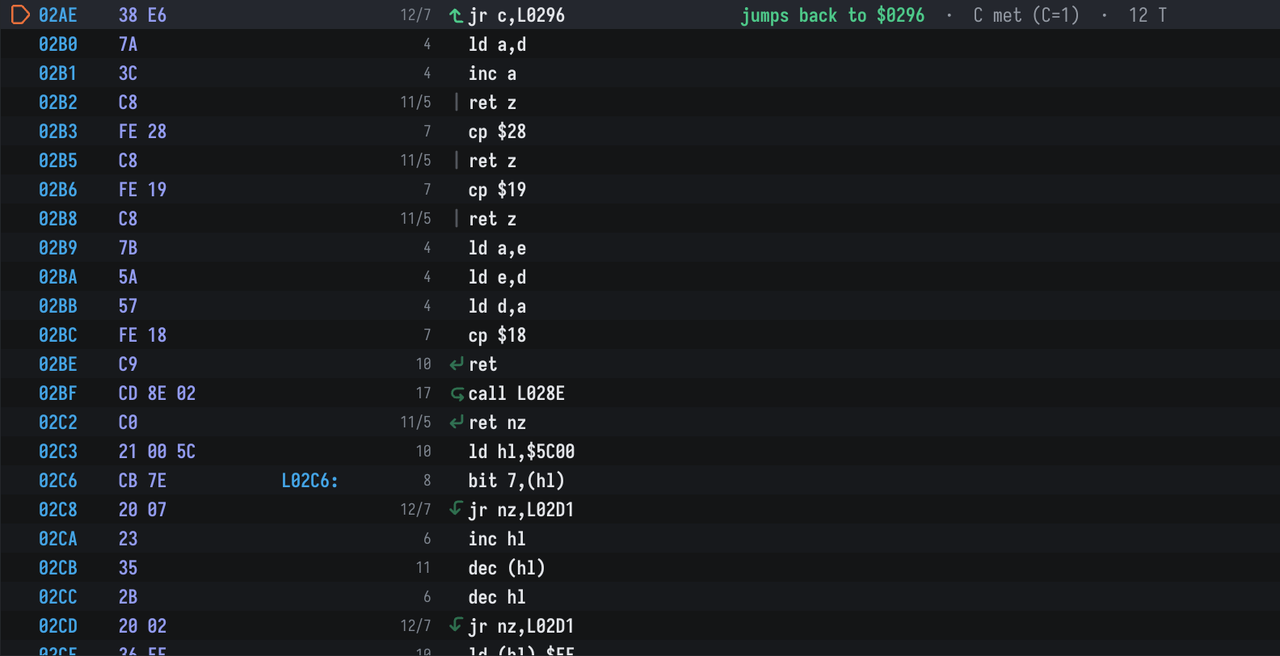
This is the end of the ROM’s keyboard scan, and it happens to show every mark a 48K listing can
produce. The execution point is a jr c about to close a loop backwards, and the readout beside it
says where to, which condition decided it, and what that costs. Below: three ret z that will not
be taken, a ret and a ret nz that will return, a call drawn as an out-and-back hook, and two
jr nz jumping forwards.
| Mark | Meaning |
|---|---|
| Arrow pointing up | The branch will jump backwards, to an address at or below its own — a loop closing. |
| Arrow pointing down | The branch will jump forwards, skipping the code between. |
| Out-and-back hook | A CALL or RST that will be taken: control leaves and comes back. |
| Arrow pointing left | A RET or RET cc that will return, leaving through the stack. |
| Dashed arrow pointing right | Control leaves, but the destination cannot be worked out. See below. |
| Straight vertical line | The branch will not be taken; execution carries straight on to the next instruction. |
Five of the six say which way control goes; the hook says something different, that control will
return here afterwards. A CALL therefore looks the same whether its target is above or below —
it is a call either way — while a JP to the same address shows a plain arrow. RST n is CALL n
in a one-byte encoding, so it takes the hook too, and its readout says calls $0008 rather than
naming a direction.
A taken branch is coloured; a fall-through is neutral grey. Falling through is not an error, so it is never marked in red — red and orange belong to breakpoints and to the execution point.
Certain and speculative marks
The mark on the row at the execution point is drawn at full strength, because the flags it was worked out from are the flags the CPU will actually use.
Every other mark is dimmed, and this difference matters. A branch ten instructions below PC is judged against today’s flags, not the flags that will hold when execution finally reaches it — and the code in between will almost certainly change them. Read a dimmed mark as “this is what would happen if the CPU arrived here right now”, not as a prediction.
The execution point readout
The row at the execution point also spells the verdict out in full, after the instruction:
jumps back to $0EFD · NC met (C=0) · 12 TIt names where execution goes next, which condition decided it, the flag value behind that decision, and the T-states the instruction will actually spend — a conditional branch costs a different number of cycles depending on which way it goes, and this is the one it will really take.
In a narrow panel the readout shortens to → $0EFD C=0 12T. Hover it to see the full sentence.
Verdicts appear only when a machine is started. With no machine running there is no CPU state to judge against, so the view looks exactly as it always has — no extra column, no shifted layout. Verdicts are shown for Z80 and Z80N machines only.
Destinations that cannot be worked out
Three cases show a verdict but no destination, on purpose:
JP (C)on a ZX Spectrum Next jumps to an address whose low bits come from reading an I/O port. That read has not happened yet, and performing it just to fill in a debugger display would disturb the machine you are debugging. The readout says so rather than guessing.RET ccaway from the execution point. The return address sits on the stack, and the top of the stack belongs to whatever is executing now, not to the row you are looking at. It is only shown for the row at PC, where it is genuinely that instruction’s return address.RET ccin a banked view. With the 64K View switch off, the view holds one bank rather than the whole address space, so the stack is not part of what is on display.
While the machine is free-running rather than paused, the marks follow the CPU state as it is sampled, a few times a second. Pause or single-step for a verdict that stands still.
Banked Disassembly Views
When your model supports memory paging, a new switch, 64K View, is displayed in the second header row. It is turned on by default, and the current 64K memory (according to the current memory page settings) is displayed. When you turn this option off, you can choose the bank to display (ROM pages or RAM banks, depending on the machine type) from the Select bank dropdown. The Disassembly View will display only the disassembled contents of that segment, even if that segment is not paged in.
The Offset dropdown lets you select a disassembly offset from one of the 8K page boundaries. This selection may help set a disassembly base address to emulate the page’s location.
Popped-Out .NEX Banks
A bank of a .NEX file opened as its own document shows the same disassembly listing, with a toolbar
of its own. Beside the Go To box is a button that scrolls the listing to the program counter,
the same way the arrow does in the Disassembly View.
It is available only when the machine is paused and the program counter is currently inside this bank. Both halves matter, and neither is fussiness:
- A running machine’s program counter has moved on by the time it is read, so the row it scrolled to would be an arbitrary instruction rather than the one about to execute.
- A pop-out shows one 16K bank. The program spends most of its time in other banks, and a bank the processor is not in has no row to go to at all — so the button is off far more often here than in the Disassembly View, and that is the honest answer rather than a fault.
The header’s Bank readout tells you which case you are in: it ends with · PC exactly when the
program counter is in this bank. The button lands on the row carrying the execution-point marker,
which follows the listing’s own numbering — so it is right even when the Offset dropdown
lists the bank at an address it is not paged at.
Machine-Specific Memory Partitions
The bank column and the bank chooser name partitions exactly as the rest of the IDE does. See Machine-Specific Memory Partitions in the Memory View for the names each machine uses.