The Breakpoints View
With this view, you can overview and manage the breakpoints used for debugging. You can find this view in the Debug activity tag with the BreakPoints header:
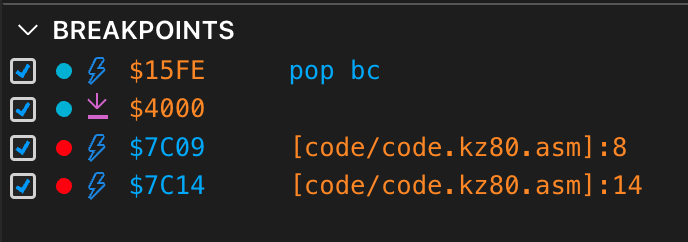
This view displays every breakpoint, whether you created it here, with an interactive command, or in the source code. Each line represents a particular breakpoint with this information:
- A checkbox shows if the current breakpoint is enabled or disabled. You can set this status by toggling the checkbox.
- A filled circle representing the status of a breakpoint:
- cyan: This breakpoint has been created with an interactive command.
- red: This breakpoint has been created in the source code.
- orange: This color indicates that a breakpoint has been created in the source code but not resolved to an actual address as the code has not been compiled (after opening the project or editing the code).
- gray: This breakpoint has been disabled.
- An icon representing the breakpoint type
- The breakpoint’s address or source code location
- Other information (such as the disassembly at the location)
Manipulating Breakpoints
When you hover the mouse over the first two icons, they display additional information:
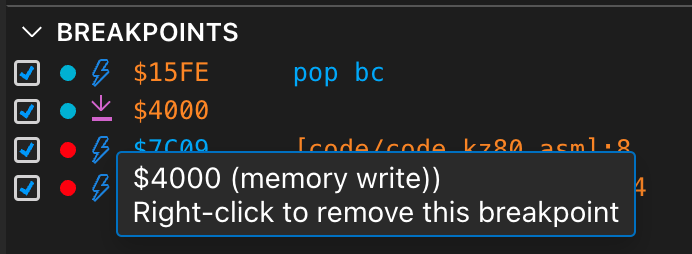
With the right mouse button on a breakpoint’s indicator, you can remove that breakpoint. If you want to deactivate one temporarily, disable it by clearing the checkbox on its left.
The toolbar at the top of the view adds two more actions:
- Add breakpoint (the + button) opens the breakpoint dialog described below.
- Remove all breakpoints erases the whole set. This is the same operation as the
bp-eacommand, so it removes source-code breakpoints as well; the confirmation tells you how many of those are about to go.
Right-clicking a breakpoint’s row opens a menu with Edit breakpoint, Enable/Disable, Remove breakpoint, and Remove all breakpoints. Double-clicking a row opens the editor directly. You can also double-click a breakpoint’s indicator in the Disassembly View to edit it there.
Running To A Line
Holding Ctrl (Cmd on macOS) and clicking the breakpoint margin beside a line runs the machine until it reaches that line, then stops. No breakpoint is left behind: the one Klive uses is removed as soon as it is reached, and it is never written to your project. The gesture is listed in the margin’s tooltip along with the right-click and double-click actions.
This works in the Disassembly View and in a popped-out ZX Spectrum Next bank, where
it runs to an offset inside that bank — wherever the bank happens to be paged. The same action
is available as the run-to command, which also explains what happens
when the machine is running rather than paused.
The Breakpoint Dialog
The Add breakpoint button and the Edit breakpoint command both open a dialog that offers
every option the bp-set command accepts, without the flag syntax:
- Type — execution, memory read, memory write, I/O read or I/O write. A breakpoint has exactly one type, so choosing one here replaces the last.
- Break only in a specific partition — shown only on machines that page ROMs or banks, and not available for I/O breakpoints, which watch a port rather than a partition. Ticking it reveals the same partition chooser the Memory View uses: a short list on a machine with a handful of banks, and the bank matrix on a machine like the ZX Next, whose 247 partitions no list could sensibly hold. The names it offers are the machine’s own; see Machine-Specific Memory Partitions.
- Address (or Port, for the I/O types) — accepts the same literals the commands do:
$8000,32768or%1000000000000000. On the ZX Spectrum Next it also accepts the bank-relative form,05:+$0100, described below. Typing one disables the partition row: a bank-relative breakpoint already names its bank, so there is nothing left to choose. - Port mask — only for the I/O types. Leave it empty to match the port exactly.
- Enabled — clear this to create a breakpoint that is set but not armed.
The dialog refuses an address that already has a breakpoint of the same type rather than silently
merging the two, which is what bp-set does on the command line.
The dialog edits binary breakpoints — those bound to an address. Source-code breakpoints
belong to the editor, which places them when you click in the left margin beside a line and moves
them with the line as you edit. That is why the row menu offers no Edit command for them; you
can still enable, disable, and remove them from this view. To script one, use
bp-set [myfile.asm]:12.
Bank-Relative Breakpoints (ZX Spectrum Next)
A partition-scoped breakpoint sits at one Z80 address and fires only while a particular partition is paged there. That is the wrong shape for code that moves a bank around: the same routine appears at a different address depending on which slot its bank is in.
A bank-relative breakpoint names the bank and an offset inside it instead, and fires wherever that bank is paged:
bp-set 05:+$0100This breaks at offset $0100 inside 16K bank 5. The bank is a 16K bank number in hexadecimal (00
to 6F) and the offset runs from $0000 to $3FFF — the same units a NEX file and the
.bank pragma use. bp-del and bp-en take the same form.
A ZX Next memory partition is an 8K page, while a bank here is 16K — so a bank-relative
breakpoint resolves to one of the two partitions making up that bank, depending on whether its offset
falls in the bank’s low or high half. That distinction is what lets the breakpoint tell $0100 in
bank 5 apart from $2100 in the same bank when only one half is paged in. See
Machine-Specific Memory Partitions.
Bank-relative breakpoints are not available for the I/O types, which watch a port rather than memory.
Setting One Without Typing
Open a NEX file and pop one of its banks out into its own document (the button in the bank’s heading), then switch that document to Disassembly. Clicking the breakpoint margin beside a line sets a bank-relative breakpoint at that line’s offset — so it will fire wherever the bank ends up paged when the program runs. The bank preview inside the viewer itself is a plain byte dump and has no margin to click.
Those breakpoints are stored in the file’s .nex.dis sidecar rather than in the project, so they
survive a restart even with no project open — and are kept per NEX file rather than shared
between them.
Each bank’s heading in the NEX viewer shows how many breakpoints that bank carries, so you can see which banks are armed without expanding them; hover the count for the breakdown by type.
Following The Program Counter
While the machine is paused and the program counter is inside the bank you have popped out, that
bank’s disassembly highlights the current instruction, and the toolbar’s bank readout gains a PC
marker naming the offset. It is the same highlight the Disassembly View draws.
Paused only, on purpose: the bank listing does not change as the machine runs, so a mark sampled from a running machine would land on an arbitrary instruction while looking authoritative.
Seeing What The Program Changed
A popped-out bank shows the bank as the machine has it right now, in both its memory and its
disassembly view, with every byte that differs from the file marked and counted in the toolbar. A
Live marker in the toolbar tells you that is what you are looking at. When no machine is running
there is nothing to read, and the bank falls back to the bytes the file holds.
That difference is often the thing you are looking for: self-modifying code, a routine that decompressed itself over its own packed data, or a bank a stray write has damaged. None of it can be told from a clean load by looking at the file.
It works for every bank in the NEX, including banks the program has paged out — the bytes are read from the machine’s RAM, not from the address space. It applies only on the ZX Spectrum Next.
Disassembly Aligned To The Program Counter
Disassembling a bank from its first byte is a guess about where instructions begin. One byte of data decoded as an opcode shifts every boundary below it, and self-modifying code or a jump table can make that guess wrong for the rest of the bank.
A paused Z80 sits between instructions, so the program counter is the one offset where the alignment is known rather than guessed. While the machine is paused with the PC inside the bank, the listing is cut there and re-decoded, so the rows from the PC on are the instructions that will actually run.
A listing that was already aligned at the PC is left exactly as it was, so stepping through ordinary code does not reshuffle it. Where the old alignment was wrong, you will see the instruction straddling the PC overlap the row beneath it — that overlap is the disagreement between the two decodes, and it is shown rather than hidden.
Regions you have annotated as bytes, words or skip are never cut: those say what the bytes
are, and the program counter passing through does not make them code.
A bank-relative breakpoint only fires while its bank is actually paged in — which is the point of it, but it means a breakpoint can look inert simply because the program has that bank paged out right now. The popped-out bank’s toolbar tells you: it reads Bank at $8000 when the bank is in the address space, or Bank not paged in when it is not. Hover it for the 8K slot numbers. A paged-out bank keeps its breakpoints; they fire as soon as it comes back.
Bank Watchpoints
The Memory read and Memory write types work with a bank-relative address, which gives you “stop when this byte of this bank is written, wherever the bank is paged”:
bp-set 05:+$0100 -wTwo ways to get one without typing:
- click the breakpoint margin in a popped-out bank to create an execution breakpoint, then double-click it and change Type in the dialog;
- or use Add breakpoint in the Breakpoints panel and type the bank-relative address in the Address field.
The disassembly margin draws one mark per line, so a line carrying both an execution breakpoint and a watchpoint shows the execution one. Both are always listed in the Breakpoints panel, and both count towards the bank heading’s total.
Resolved Source Code Breakpoints
When you open a project or modify an assembly source code file, the source code breakpoint addresses are not resolved to an actual physical address. The orange color of a source code breakpoint indicates this status:
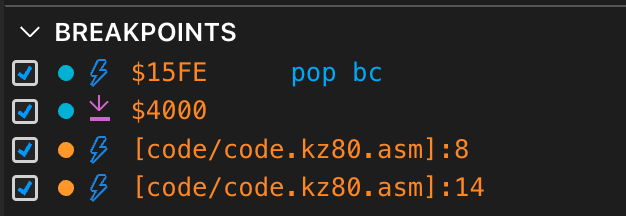
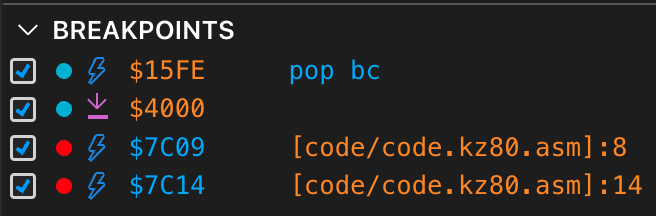
Source code breakpoints are resolved to a CPU address after compilation, and this address is displayed with the breakpoint. The following figure shows that the last two source code breakpoints display their resolved CPU address after the compilation.
Breakpoint Types
The second icon of the breakpoint item displays its type. There are five types of breakpoints (depending on the operation triggering the machine to pause), as the following figure shows:
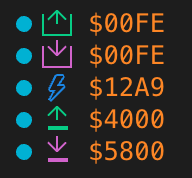
These are the available breakpoint types (from top to bottom in the figure):
- I/O read. This breakpoint is triggered when a particular I/O port has been read. The displayed address is the 16-bit I/O port address.
- I/O write. This breakpoint is triggered when a particular I/O port has been written. The displayed address is the 16-bit I/O port address.
- Execution. This breakpoint is triggered when the PC register reaches the specified address.
- Memory read. This breakpoint is triggered when a particular 16-bit memory address (including instruction fetches) has been read.
- Memory write. This breakpoint is triggered when a particular 16-bit memory address has been written.