The Execution History
This is one of Klive’s advanced debugging features, which are on by
default; if you turned them off, run set -u features.advancedDebugging 1 in the IDE, then restart Klive.
A breakpoint stop answers where the program is. The Execution History answers how it got there: it lists the last instructions the CPU executed, newest at the bottom, each with the registers it changed, the bytes it ran and the source line it came from.
The Execution History is available on every Z80 machine: the ZX Spectrum 48K and 16K, 128K, Pentagon 128, +2A/+3/+2E/+3E and Next, the Scorpion ZS-256, the Timex TC2048, TC2068 and TS2068, the Cambridge Z88, and the ZX80 and ZX81. The Commodore 64 does not record history.
Recording
History is recorded only in debug sessions: after Start with Debugging and while you step. A plain Start records nothing and costs nothing. The header says whether the machine is recording now.
Klive keeps the last 131,072 records on the Next (about two frames at 28 MHz, about fifteen at 3.5 MHz) and the last 65,536 on the other machines (about seven or eight frames of a Spectrum program). The history runs on across pauses, steps and continues; it starts over when the machine starts from Stopped, after a reset, and after a machine state, snapshot or checkpoint is restored. Clear in the header empties it on demand.
Opening it
Use Debug → Execution History, or the command:
show-historyThe document reads the history whenever the machine stops. While the machine runs it says so: the history changes far faster than any view could follow.
The rows
| Column | Shows |
|---|---|
| Step | −1 for the newest record, −2 for the one before, and so on. |
| Time | The position in the frame when the instruction started, in T-states (on the Next, in 28 MHz ticks). A hairline marks the first record of each new frame. |
| Address | The memory bank (partition) and the address of the instruction, from the paging at the time it ran. |
| Bytes | The bytes the CPU executed. They are captured as the instruction runs, so self-modifying code shows what really ran, not what is in memory now. |
| Instruction | The disassembly, with labels from the current compilation. An arrow marks calls, returns and taken jumps. |
| Source | file.asm:123 when the address maps to your source; in banked code, the bank the instruction ran in decides which source line. |
| Changes | The registers the instruction changed, and the flags it set or cleared: HL=8001 SP=FFFC Z↑ C↓. |
Some records are not instructions:
- An interrupt reads
— IM 2 interrupt, vector $FF —; the interrupt routine’s first instruction is the next row. - An NMI reads
— NMI —. - A CPU waiting in HALT is one row with a count,
HALT ×1,203, however long it waited. - On the ZX80 and ZX81, the CPU “runs” the display file to draw the picture, and the ULA turns
each character into a NOP. One display line is one row with a count,
Display NOPs ×32, not 32 rows. - When the DMA held the bus, the row says for how long and what it copied:
— DMA held the bus for 3,072 T ($4000 → $C000, 0 left) —.
Looking at one record
Click a row to select it. The pane beside the list shows the full register set before and after that instruction, with the changed values marked, the frame and position, and the memory map at the time: the bank in each slot and the paging ports (on the Next also DivMMC and the CPU speed; on the Timex 2068s the source of each 8K chunk; on the Z88 the segment registers and the bank behind each 8K page).
Double-click a row, or press Enter, to go to its source line; a row with no source shows the address in the disassembly. ↑ and ↓ move the selection. The context menu also offers Show in disassembly, Show in memory, Copy row, Copy rows as text (from the selected row to the newest) and Set breakpoint here.
Folding interrupts
Interrupt routines can bury the program you are debugging: a ZX81 in SLOW mode takes an NMI on every blank scan line and draws the whole picture from one of them. Switch on Fold interrupts in the header, and each interrupt, with every instruction of its service routine, becomes one row:
▸ NMI service, 5 instructions, 32 T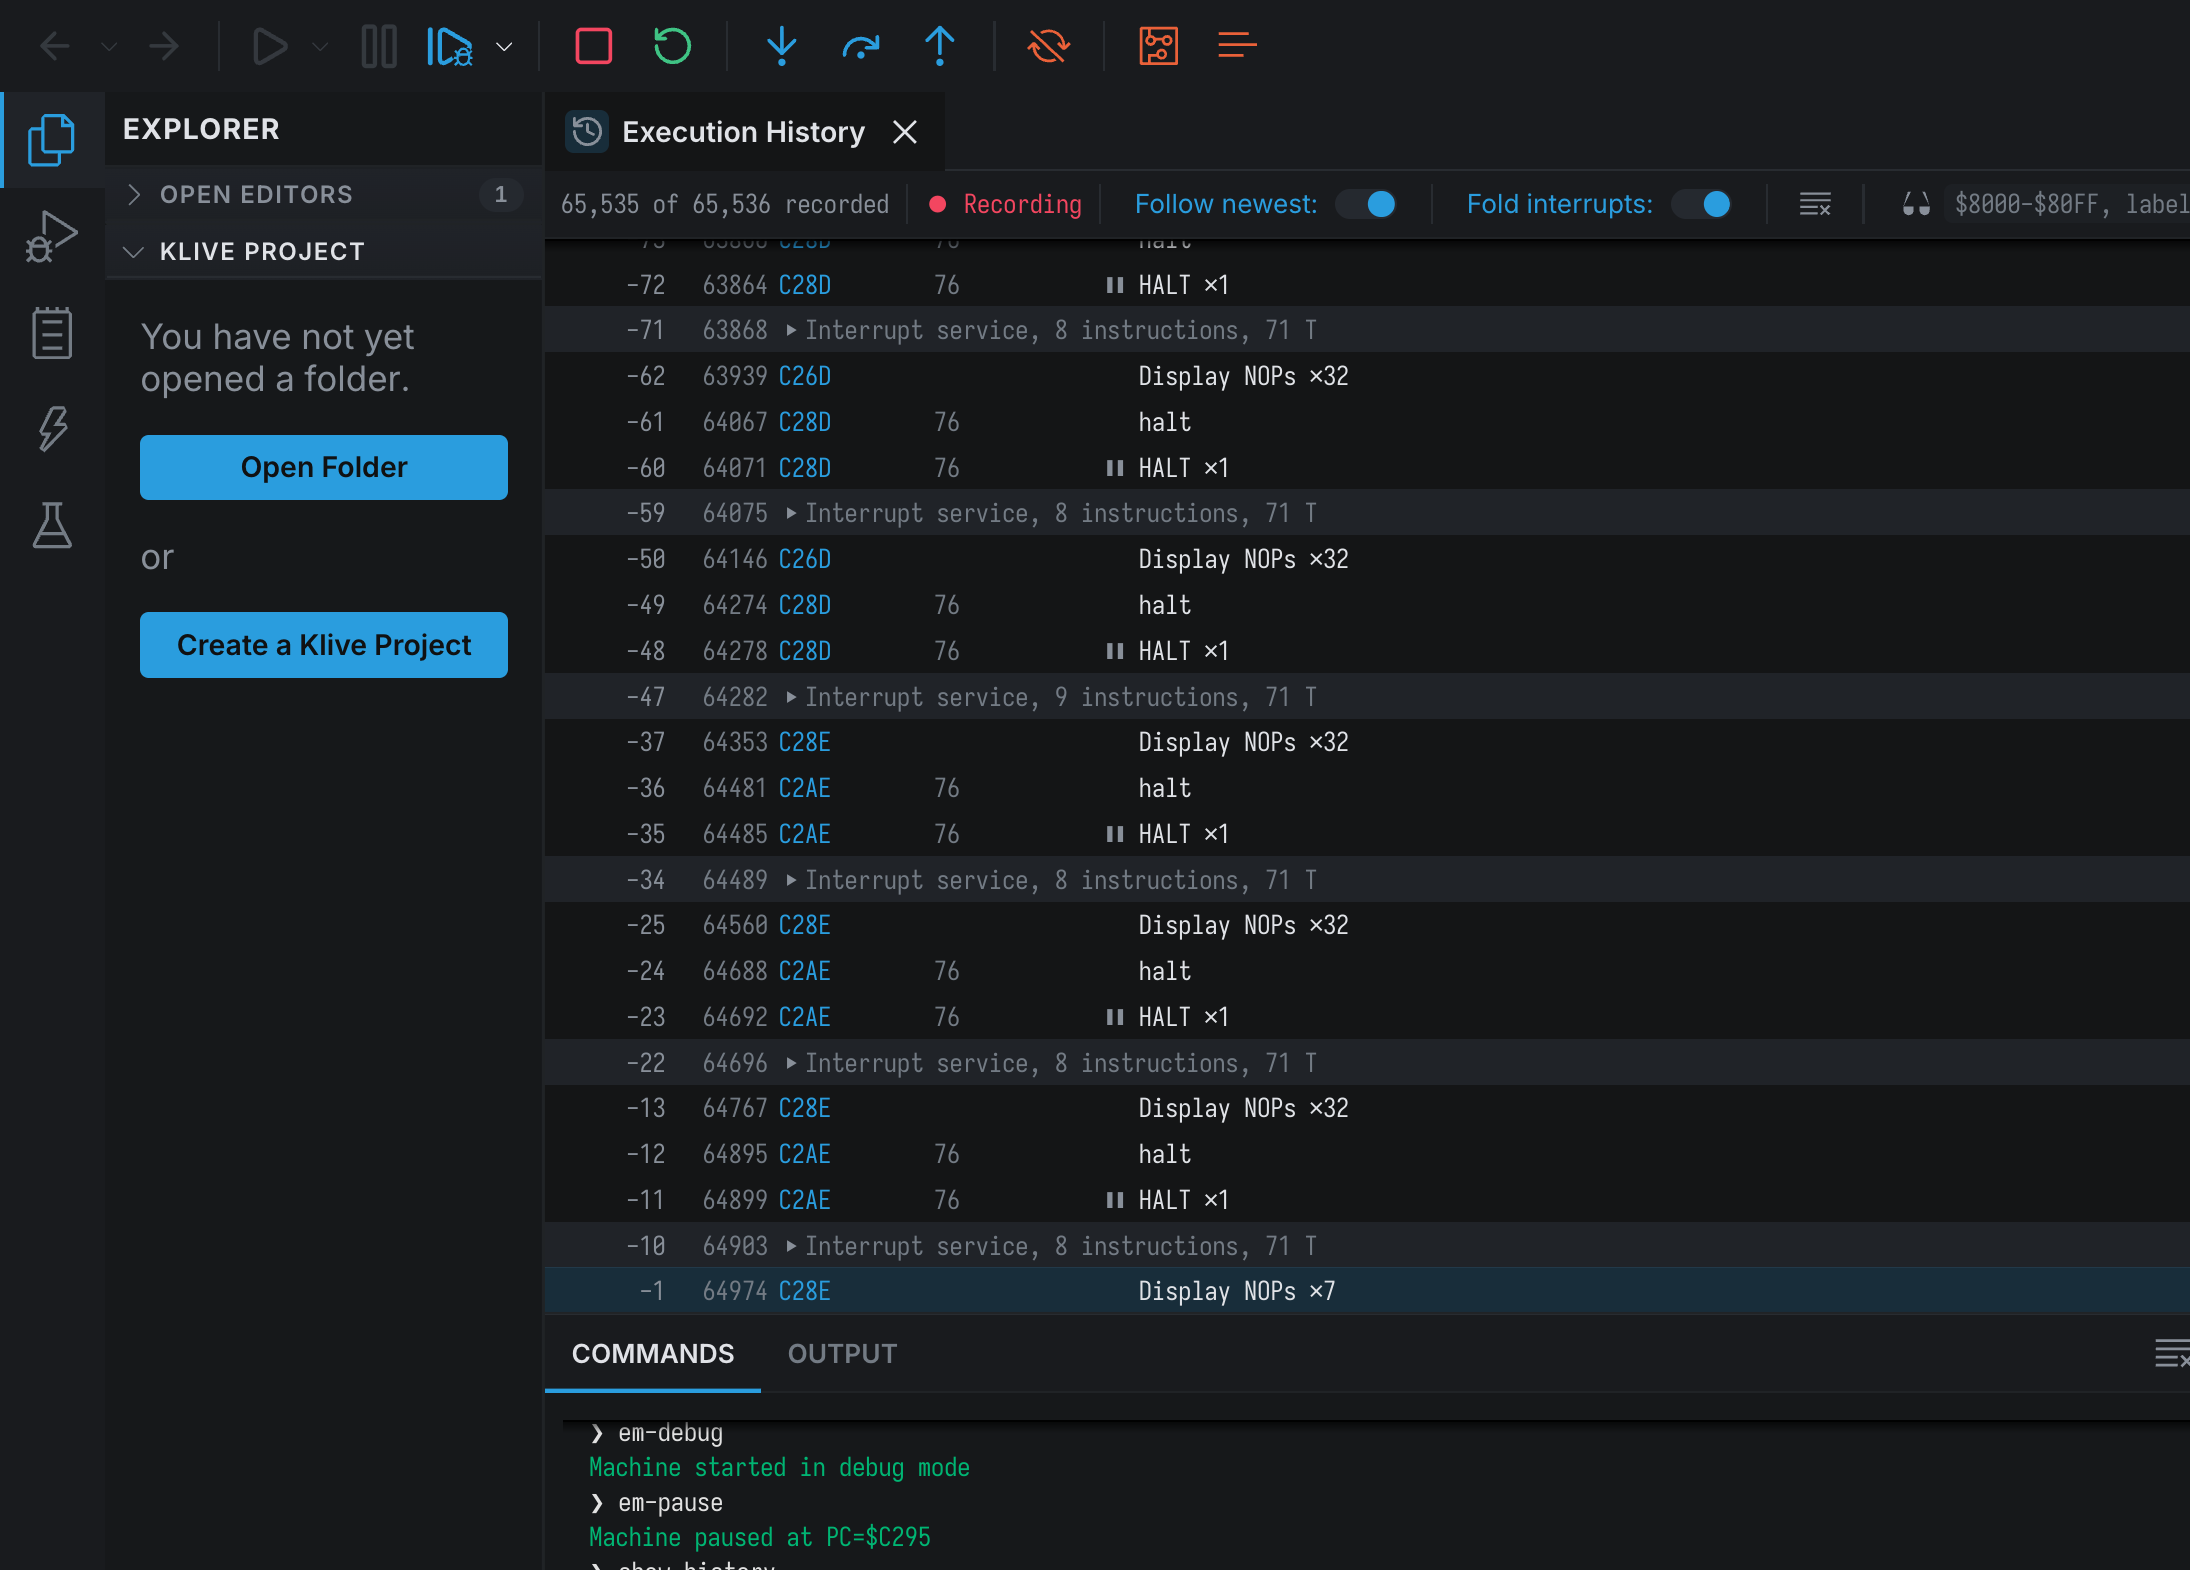
Click ▸ to open a service and see its instructions; ▾ folds it again. Nothing disappears
for good, and the step numbers run on across a folded row, so −120 is the same instruction whether
its service is folded or not. A service still running at the newest record is not folded.
The switch is on by default on the ZX80 and ZX81 and off on the other machines; Klive remembers your choice for each machine. While a filter is active, the list shows every match, folded or not.
Filtering
The filter field in the header narrows the list to:
- an address (
$8000,8000h,0x8000) or a range ($8000-$80FF); - a label of the current compilation (
MainLoop) or a range of two labels; - any other text, matched against the disassembled instructions (
call,ld a,).
Stepping back
While the machine is paused you can step back through the history and look at the program as it was at any recorded instruction. The CPU panel shows the registers, flags and interrupt state from before that instruction ran, the editor and the disassembly mark its line, and the Call Stack is rebuilt from the history.
With reverse debugging - on by default - the machine itself goes back: memory, devices and the screen show that moment too, and you can continue from it. The rest of this section describes what is the same either way, and what changes with reverse debugging turned off.
| Command | Toolbar / menu | Default key | Goes to |
|---|---|---|---|
| Step Back | ↶ | Alt+F11 (macOS Alt+F12) | the previous instruction |
| Step Forward | ↷ | Alt+Shift+F10 | the next one, and after the newest, the present |
| Reverse Step Over | Debug menu | Alt+F10 | as Step Back, but a call that returned is passed over to the CALL itself |
| Reverse Step Out | Debug menu | Alt+Shift+F11 (macOS Alt+Shift+F12) | the call (or interrupt) that entered the current routine |
| Reverse Continue | Debug menu | Alt+F5 | the previous hit of an enabled execution breakpoint |
| Return to Present | toolbar, status bar | the live machine |
On Linux the default keys use Ctrl+Alt instead of Alt. Every key is a setting
(shortcuts.stepBack, shortcuts.stepBackOver, shortcuts.stepBackOut,
shortcuts.reverseContinue, shortcuts.stepForward).
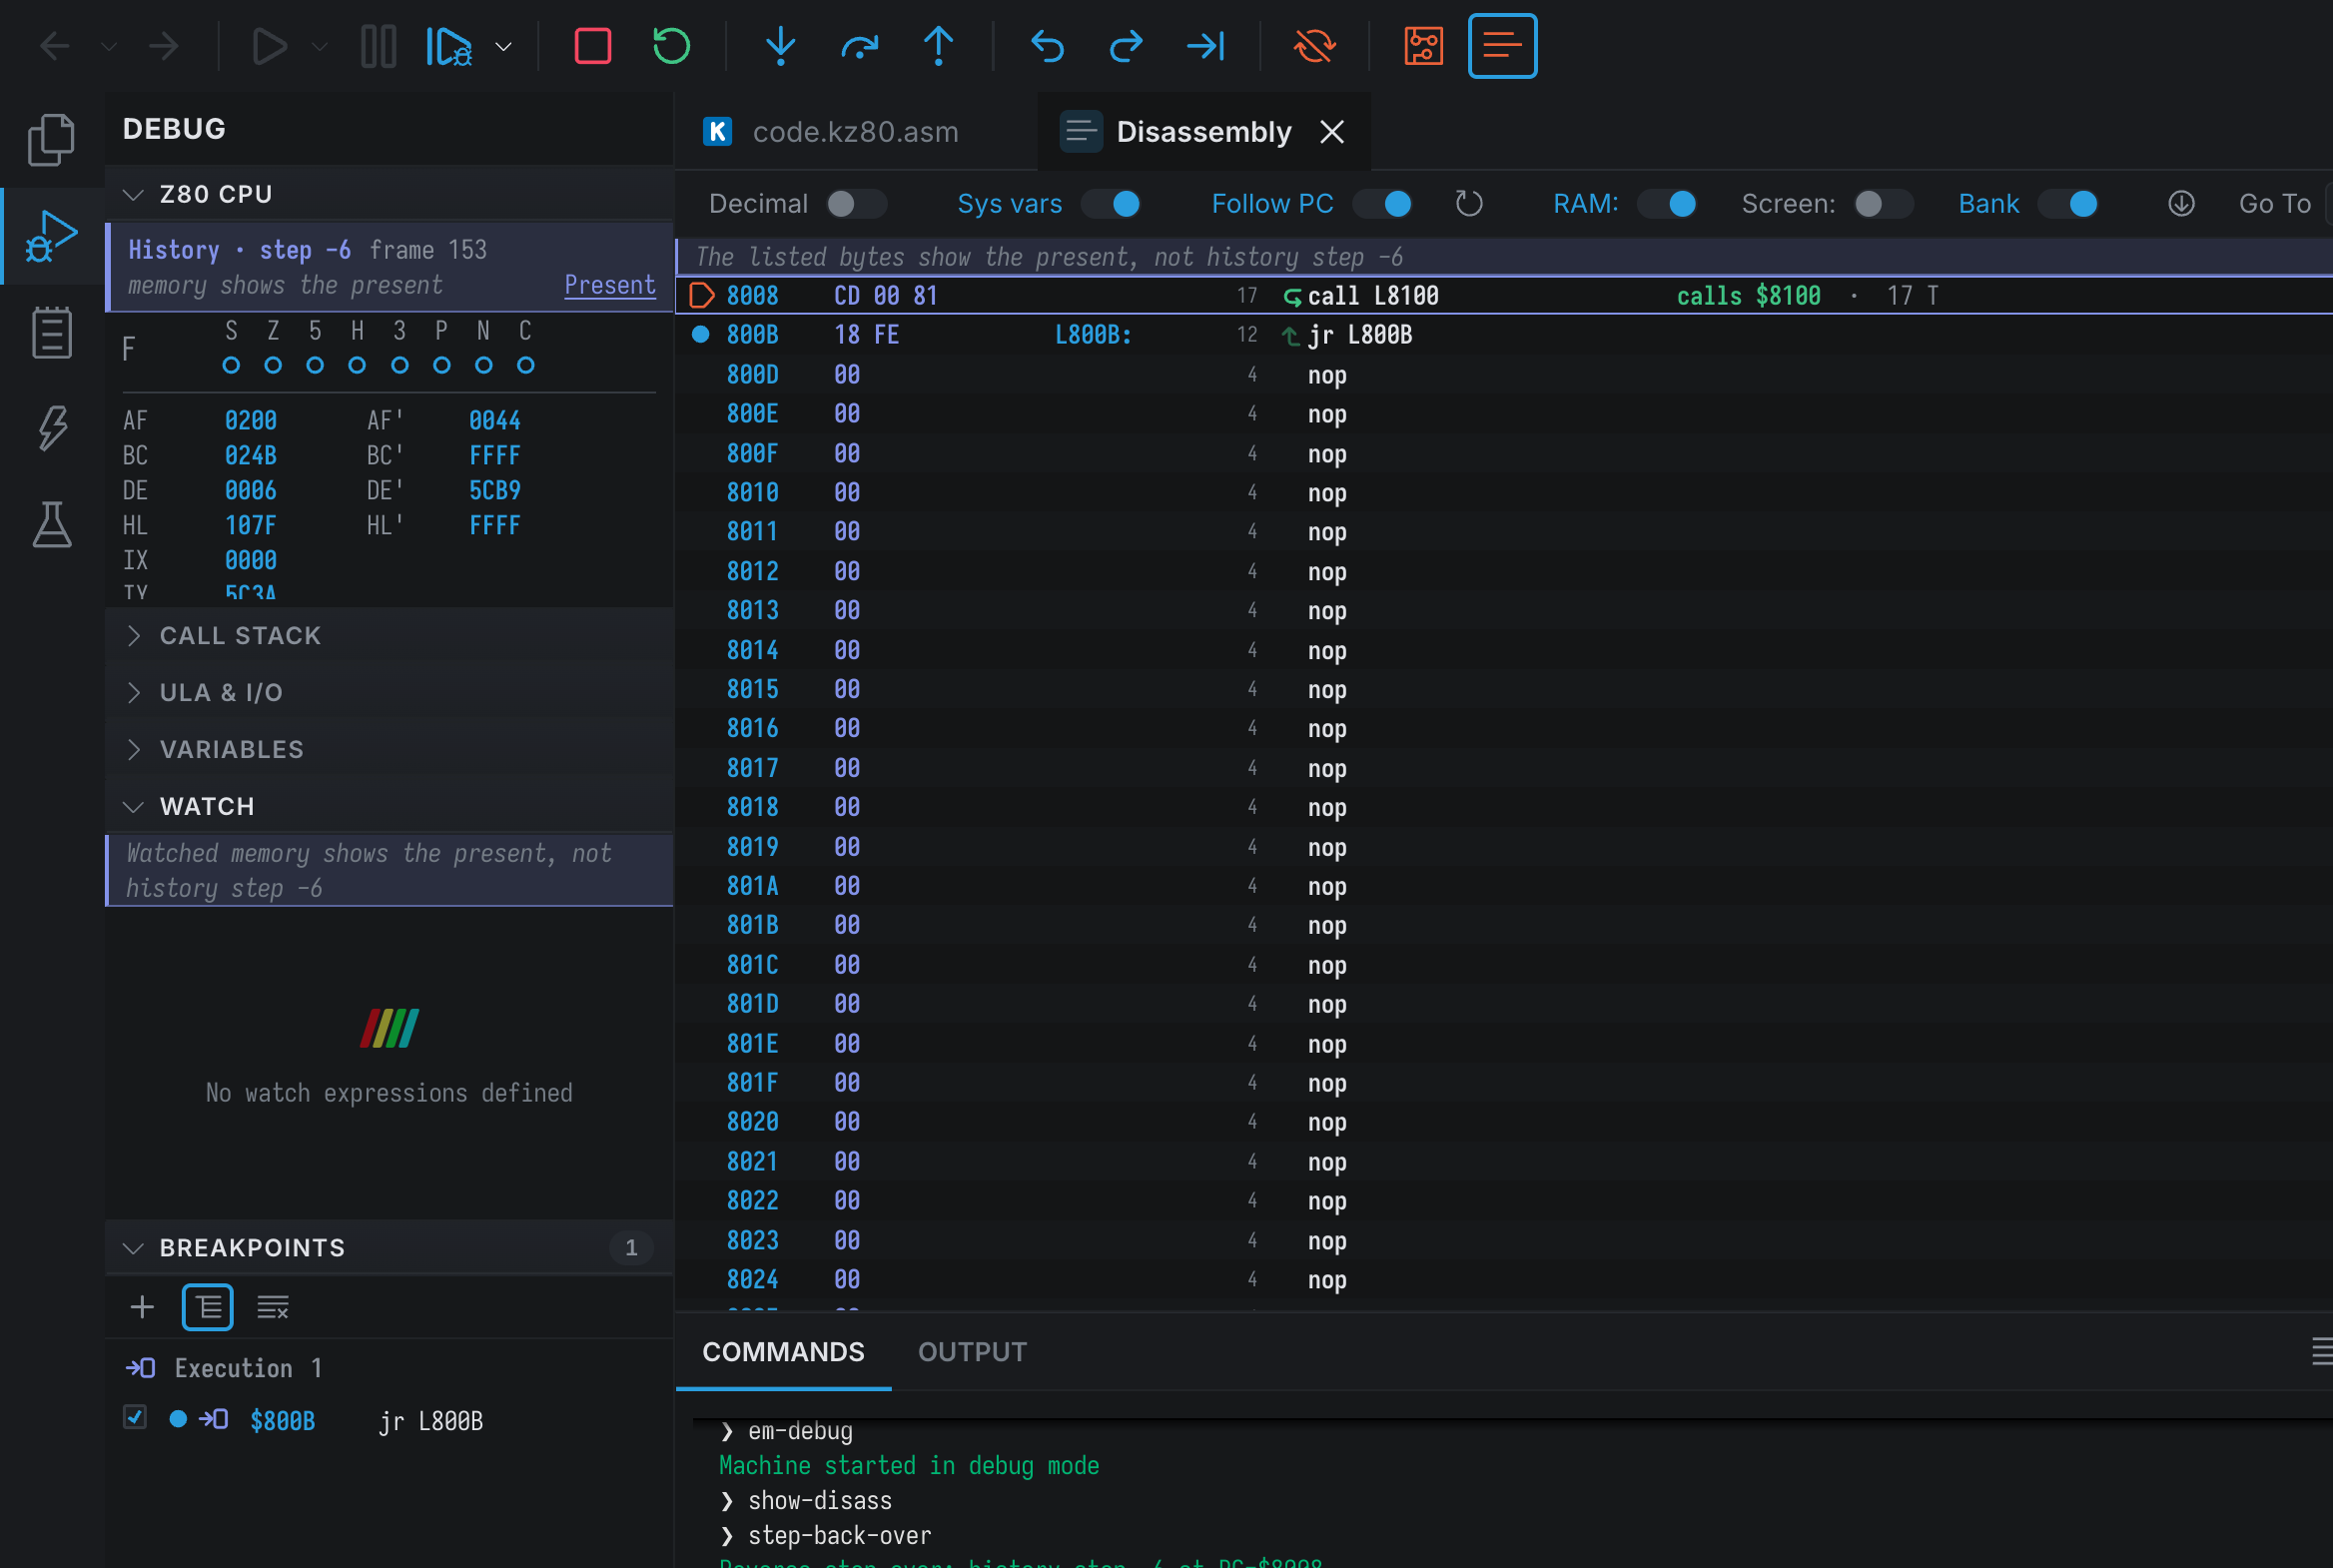
With reverse debugging off, memory shows the present. A history record holds the registers, not memory, so the Memory view, Watch, the ULA and Next panels, the system variables and the bytes in the disassembly keep showing the live machine. Each says so in a band at its top while you are in the past, and the CPU panel’s band repeats it. A disassembly row whose bytes have changed since the instruction ran has a dashed outline.
You can tell the past from the present at a glance. The present’s execution point is a solid
highlight; a historical one is an outline in the second accent colour. The status bar shows how far
back you are (⟲ −1.24 s · step −42 with reverse debugging, ⟲ History −42 without); click it to
return to the present.
With reverse debugging off, any machine command returns to the present first. Continue, the steps, Pause, Stop, Reset and register or memory edits act on the live machine. With it on, continuing and stepping replay from the past, and an edit asks to take over there.
Interrupts. Interrupt and NMI rows are not stops: stepping back from an interrupt routine’s first instruction lands on the instruction that was interrupted, and the CPU panel says the routine was entered by an interrupt. When the document folds interrupt service, Step Back and Step Forward pass over a whole service in one step. Reverse Step Over and Out always do.
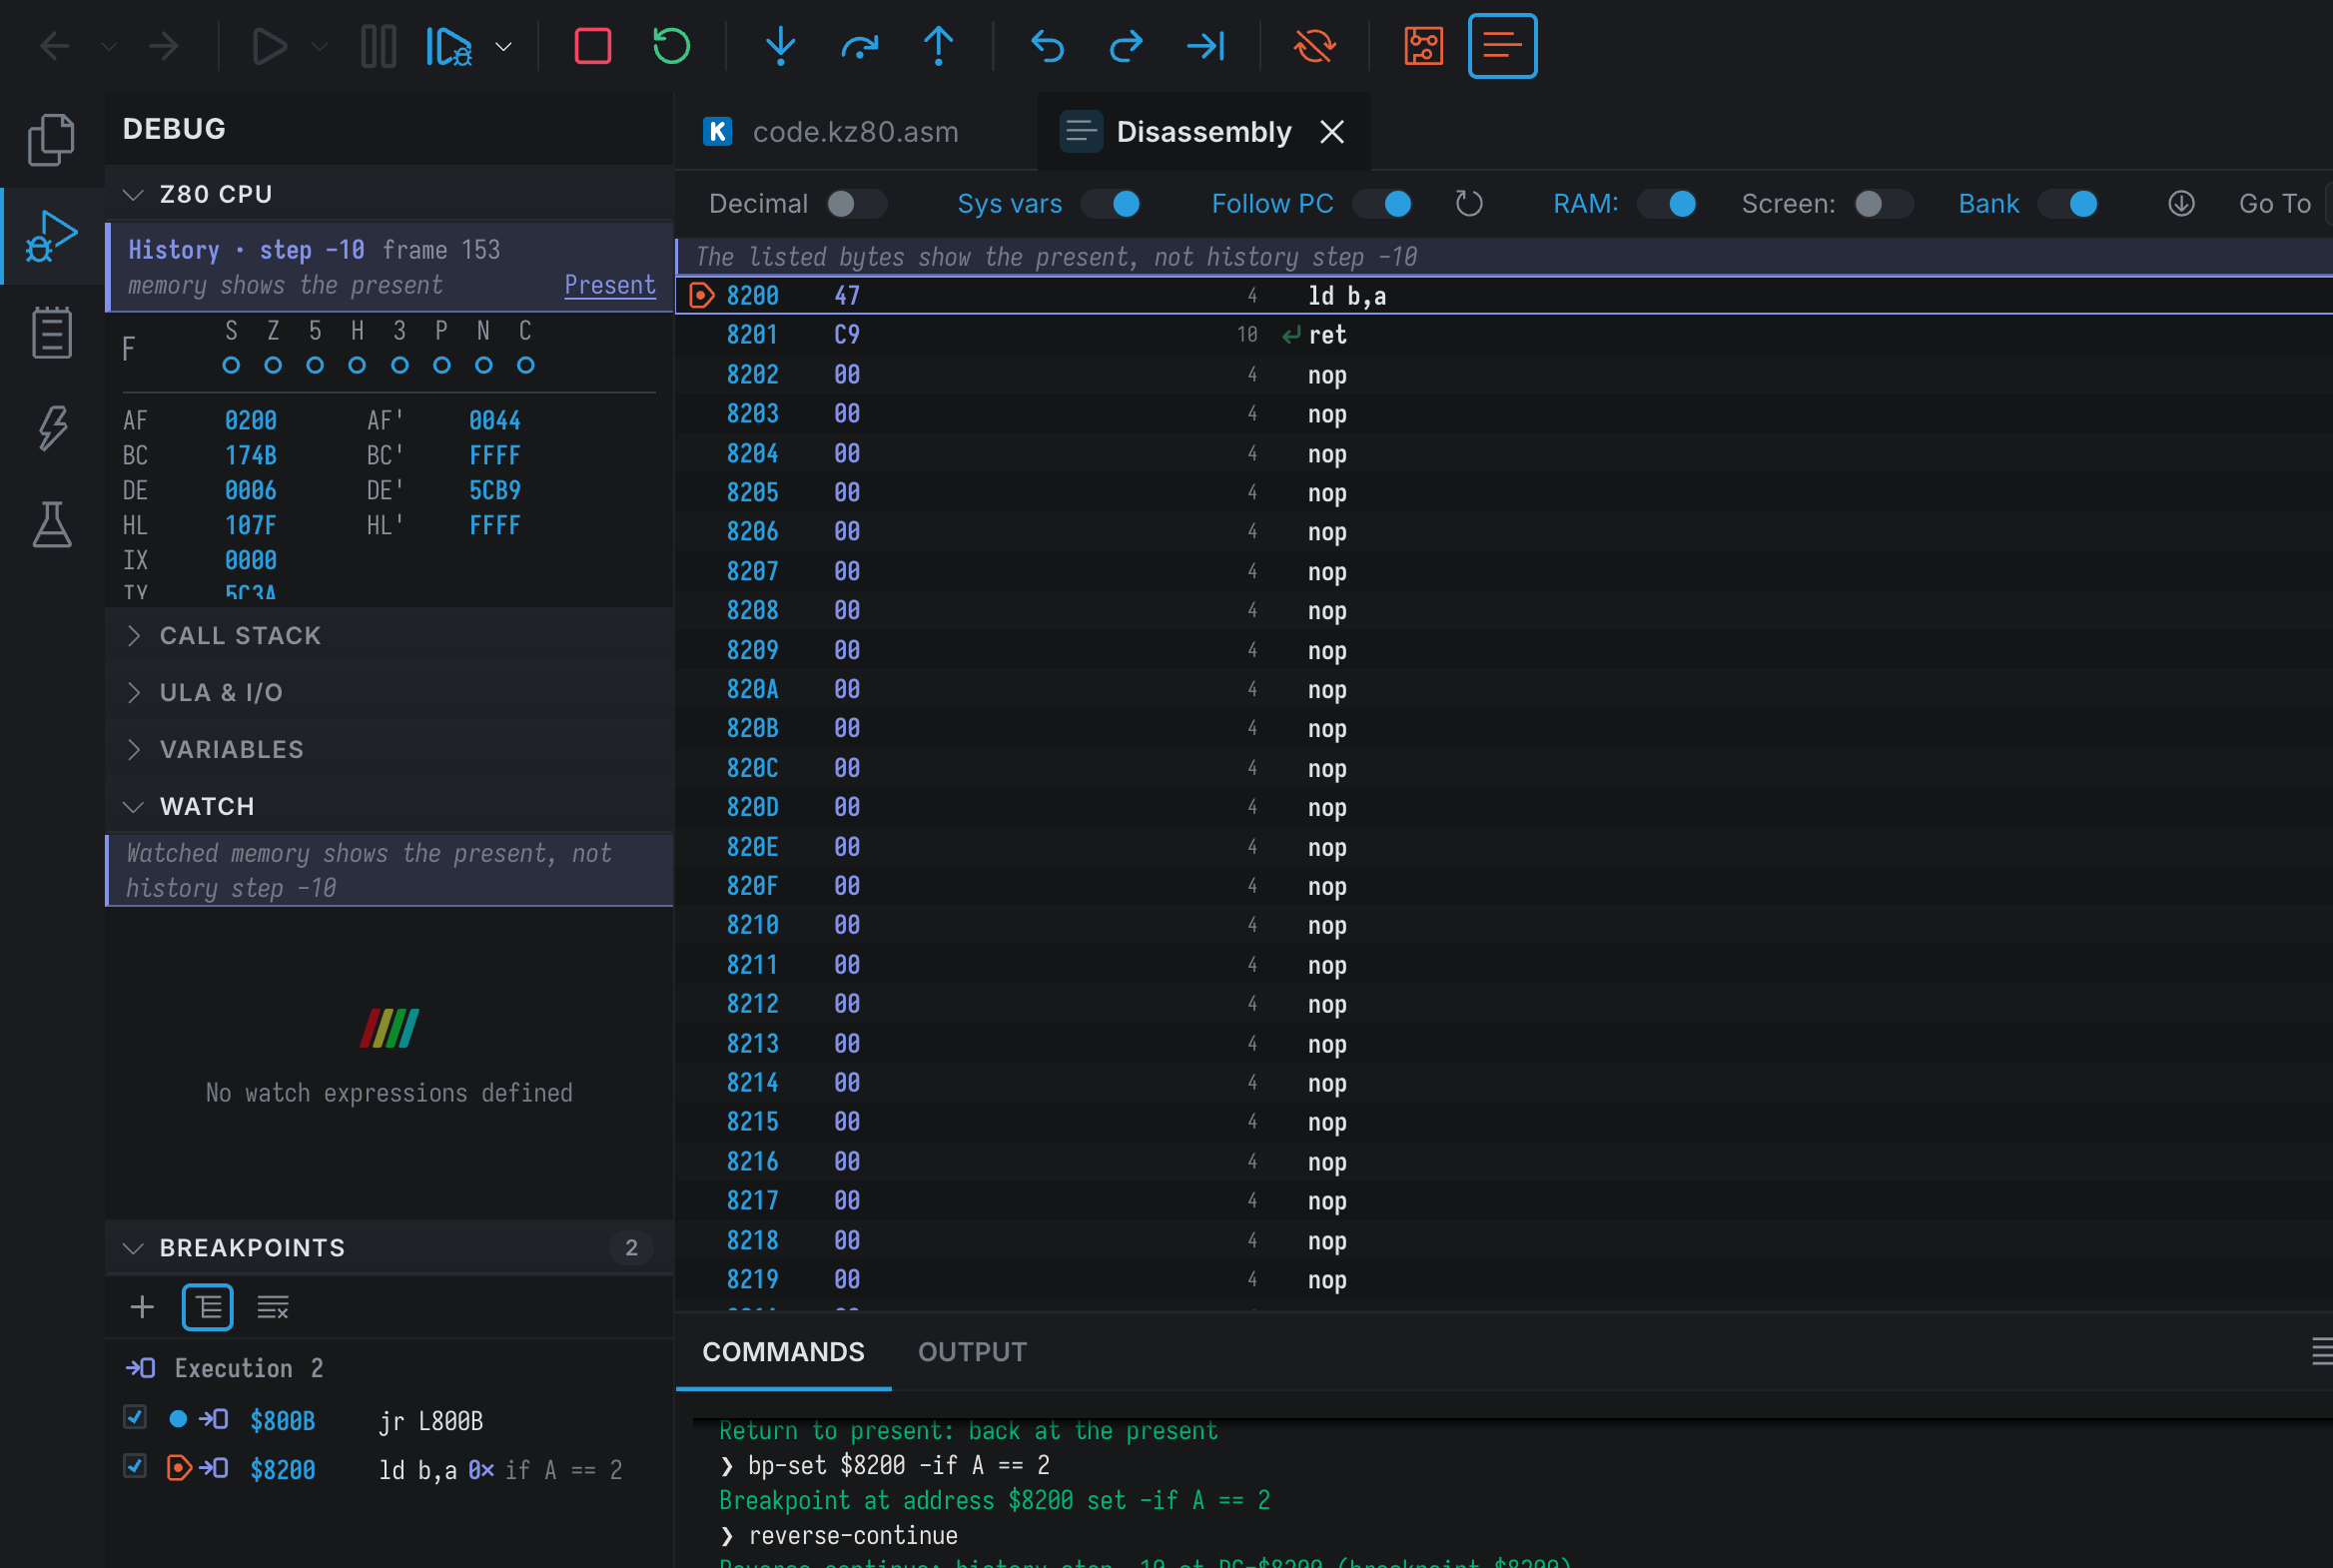
Reverse Continue and conditions. With reverse debugging, every breakpoint kind and condition is checked on the machine itself (details). Without it, a condition that reads only registers and flags is checked against the recorded registers. A condition that reads memory, ports, paging or the frame counter cannot be checked in the past, so the breakpoint counts as hit and the output says the condition was not checked. Hit counts are ignored and logpoints do not print.
Klive BASIC. With source stepping on, Step Back, Step Forward and Reverse Step Over and Out move by statements, as the forward steps do.
Selecting a row of the Execution History while the machine is paused moves there, and moving selects the row.
Stepping back stops at the start of the recorded history and says so; it never wraps.
Exporting a trace
A trace file answers “where did these two runs part ways?”. Record a good run and a bad run, export
both, compare them with any diff tool (diff, git diff --no-index, Beyond Compare, VS Code’s
compare), and the first line that differs is where the program took another path.
Pause the machine, then use Debug → Export Execution History…, the Export button (the disk icon) in the document’s header, or Export rows from here to the newest… in a row’s context menu. The document’s buttons export what it shows: its filter, and its folded interrupts left out. The command gives every option:
history-export run1.txtThe file’s extension picks the format: .txt, .log or .trace for text, .csv for a
spreadsheet. An existing file is replaced only with -f.
Comparing two runs
- Set a breakpoint where both runs should still agree, or just after the place where they stop agreeing.
- Start with Debugging, let it stop at the breakpoint, and export:
history-export good.txt. - Do the same with the run that goes wrong:
history-export bad.txt. - Compare the two files:
git diff --no-index good.txt bad.txtThe default columns are made for this. Time is written relative to the first exported record
(frame 0), so two runs that started at different moments still match line for line, and a HALT
or a ZX81 display run is written HALT ×*: how long the CPU waited is not part of the program’s
path. The header lines start with ;, and hold no export time, so two exports of the same run are
identical.
When the files differ almost everywhere but the program did the same thing, the noise is timing:
- The frame interrupt landed at a different instruction in each run, which moves the whole handler.
Add
-nointerruptsto leave out every interrupt service (a one-line… interrupt service, 312 instructions …marker stays where each was, unless you add-nomarkers). - The paths agree but the
tactcolumn does not: the first differingtactis where the timing changed. When only the path matters, leave the column out:-columns addr,bytes,instr,changes.
Options
| Option | Does |
|---|---|
-from <-n | #seq>, -to <-n | #seq> | The range, inclusive: -42 is the 42nd step back (-1 is the newest record), #1234 a record’s sequence number. By default the whole history. |
-count <n> | The newest n records, or n records from -from. |
-columns <set> | default (frame tact addr bytes instr changes), viewer (the document’s columns), all, or a list such as frame,addr,instr: seq, step, frame, tact, addr, bytes, instr, source, changes, regs, flags, ctx. |
-absolute | Absolute frame and sequence numbers instead of relative ones. |
-repeats | Write the HALT, display-run and DMA counts. |
-nointerrupts, -nomarkers | Leave out interrupt service; leave out its markers too. |
-filter <text> | The document’s filter: an address, a range, a label or text. |
-format text|csv | The format, whatever the extension says. |
-noheader | No ; header lines. |
-bom | Start the file with a UTF-8 byte order mark (Excel on Windows needs one). |
-f | Replace an existing file. |
regs is the full register set before the instruction (AF BC DE HL AF' BC' DE' HL' IX IY SP I R WZ) and flags is IFF1 IFF2 IM; changes is the document’s Changes column. Labels and source
lines come from the current compilation, as in the document; the header names its main file.
CSV has one header row of column names and no other metadata: the range, the machine and the
options go to the command output instead. The address’s bank gets a part column of its own, every
register a column of its own, and a HALT’s count a repeat column (filled with -repeats).
The export covers what the history holds now - at most the last 131,072 records on the Next and 65,536 on the other machines. An endpoint older than that is moved to the oldest record, with a warning.
Commands
show-history          ; open the Execution History
hide-history          ; close it
history-clear         ; empty the history
history 50            ; print the newest 50 records to the command output
history-export a.txt  ; write the history to a text or CSV trace (hexp)
step-back             ; step back one instruction (stb)
step-forward          ; step forward, up to the present (stf)
step-back-over        ; step back over a call that returned (stbo)
step-back-out         ; step back out of the current routine (stbu)
reverse-continue      ; back to the previous breakpoint hit (rcont)
history-present       ; return to the present (hpres)
history-goto -42      ; go to step −42, or to a record with history-goto #1234
history-take-over     ; continue from the point in the past (reverse debugging) (htake)
See Interactive Commands and the command reference.