The Profiler
This is one of Klive’s advanced debugging features, which are on by
default; if you turned them off, run set -u features.advancedDebugging 1 in the IDE, then restart Klive.
The profiler answers where the time went. While it runs, the emulator measures every instruction exactly: there is no sampling, so a routine that ran once for 40 T-states shows up just as surely as the loop that ran a million times. You get:
- a flat profile: the time spent in each routine of your program, its share, its calls and its cost per frame;
- a call graph (when you ask for it): each routine’s inclusive time (its calls included) and exclusive time (its own code only), who called it, and what it called;
- exports to speedscope flame graphs, KCachegrind/QCachegrind (callgrind), CSV, and Fuse’s profile format.
The profiler works on every Z80 machine: the ZX Spectrum 48K and 16K, 128K, Pentagon 128, +2A/+3/+2E/+3E and Next, the Scorpion ZS-256, the Timex machines, the Cambridge Z88, and the ZX80 and ZX81. It is built on code coverage’s counters, so the two share one switch: starting the profiler turns coverage on, and resetting one resets the other.
A profiling run
A profile covers a window: from the moment you start it until you stop it. Inside that window the machine may run at full speed, pause, and step.
- Debug → Start Profiling resets the profile and starts a new window, with the call graph on.
- Run the part of the program you want to measure.
- Debug → Stop Profiling freezes the data and opens the Profiler document.
Debug → Profiler opens the document at any time. Its toolbar starts, stops, clears and exports the profile too, and its Call graph switch decides whether the next start records the call graph.
Profiling exactly one pass
To measure one pass of a loop - one frame of a game’s main loop, say - let the program start and stop the window itself:
profile start -calls -at MainLoop -until MainLoopCounting starts the first time the program reaches MainLoop, and profiling stops the next time it
gets there. -at and -until take a label of the current build or an address ($8000, #8000,
0x8000, 8000h or decimal), and either can be used alone.
The Routines tab
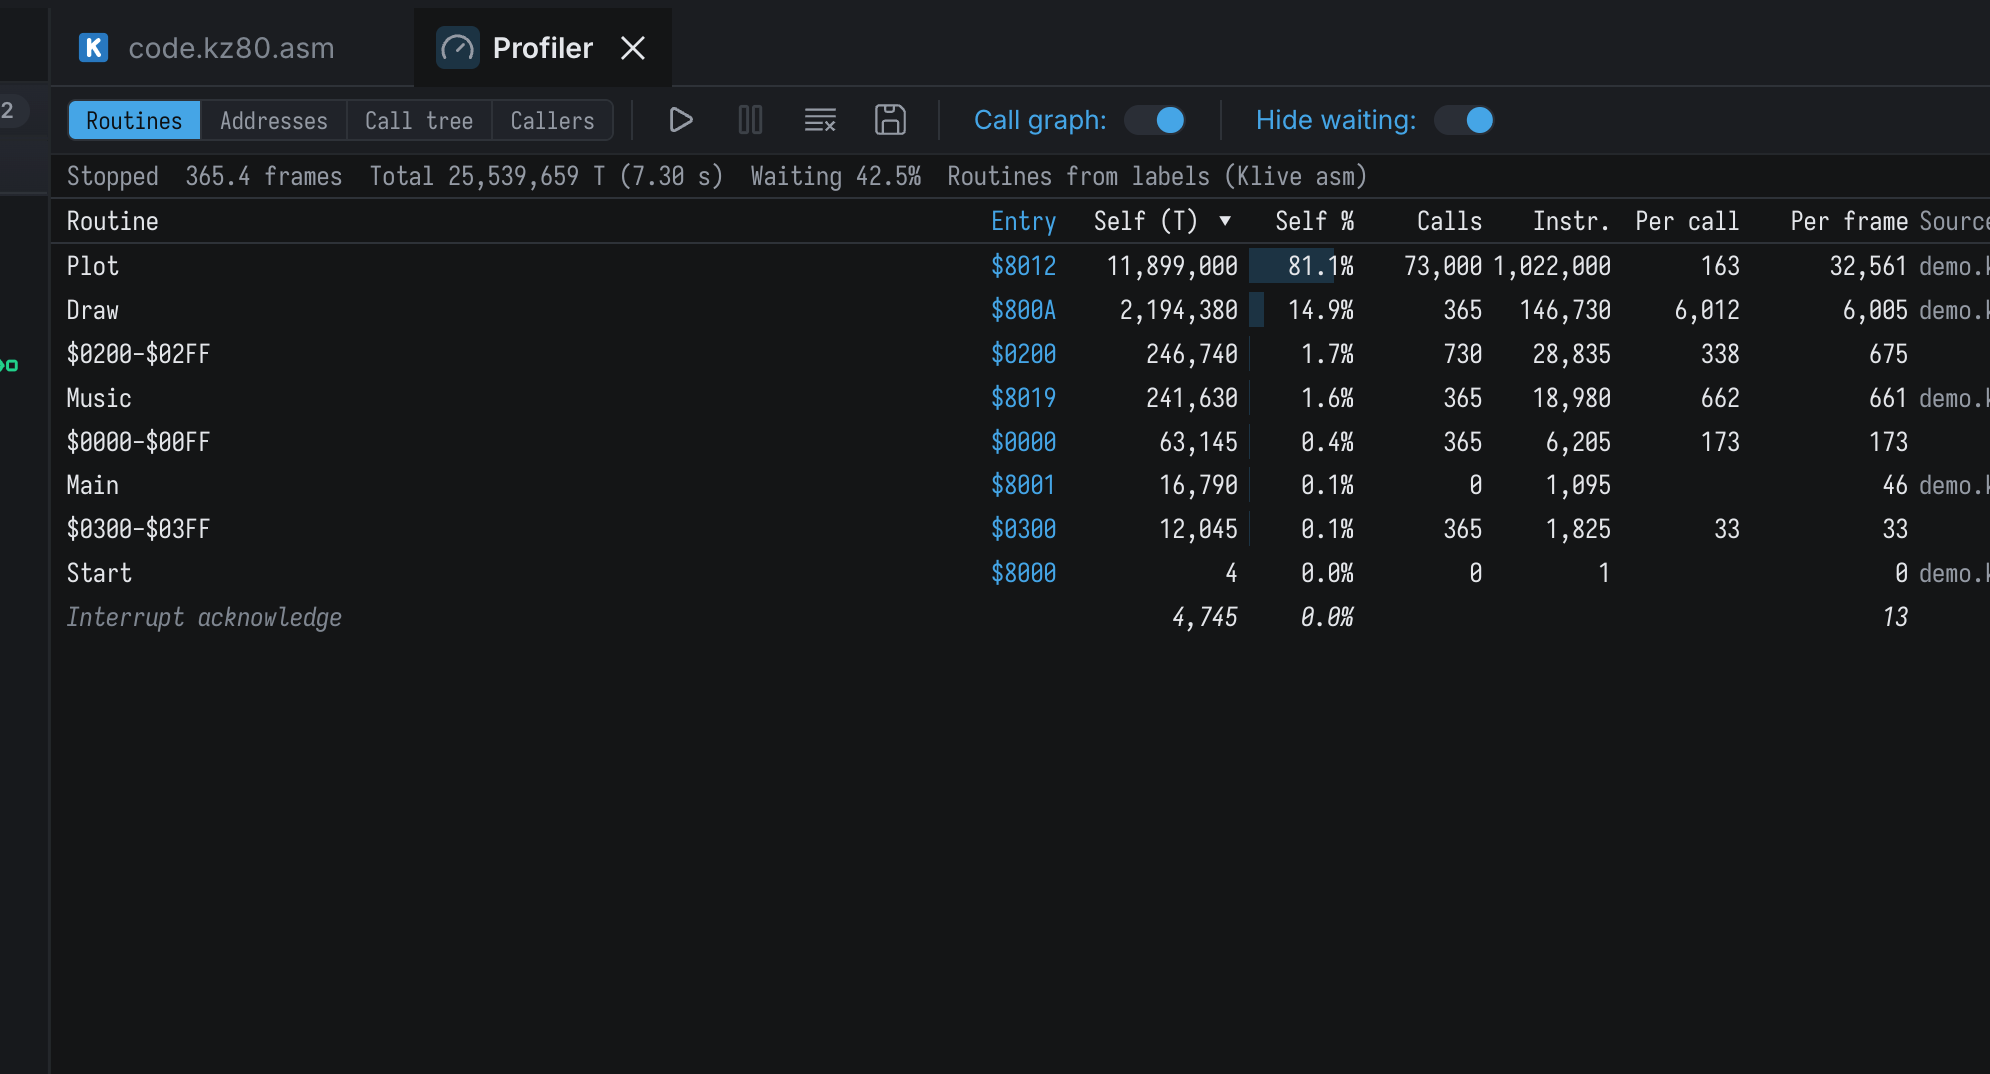
The header line describes the window: whether profiling is running, how many frames it covered,
the total time, the share spent waiting in HALT, and where the routines came from.
Each row is a routine:
| Column | Shows |
|---|---|
| Routine | The routine’s name. |
| Part. | The bank (partition) its code lives in, on machines that have banks. |
| Entry | Its first address. |
| Self | The time spent in its own instructions, in T-states (28 MHz ticks on the Next). Hover for the wall time. |
| Self % | Its share, drawn as a bar. |
| Calls | How often it was called (with the call graph), or how often its first instruction ran (Entries, without it). |
| Instr. | Instructions executed in it. |
| Per call | Self time per call. |
| Per frame | Self time per emulated frame: the number a game budgets against. |
| Source | Where it is defined. |
Click a column heading to sort by it. Double-click a row to jump to the routine’s source, or - for code without source - to its disassembly.
Rows in italics are time that belongs to no routine: Interrupt acknowledge, DMA bus hold on
the Next, Snooze on the Z88 and, when Hide waiting is off, HALT (waiting). With Hide
waiting on (the default), time in HALT is left out of the table and of the percentages, so a game
that waits 70% of every frame still shows how its working time divides.
Where routines come from
Klive names routines from the best information the build has, in this order:
- Klive BASIC
SUBs andFUNCTIONs, with their exact extents. - The Klive assembler’s
.proc….endpblocks. - Labels: a routine runs from a global label up to the next one. Local labels never start a
routine: the Klive assembler’s temporary
`labelsand labels inside a.proc, and sjasmplus’s.locallabels. sjasmplus builds on a 128K, +3 or Next device keep each label’s page, so the same address in two banks is two routines. - Call targets the call graph saw, when the build has no symbols at all.
- 256-byte blocks (
$8000-$80FF) for whatever is left, such as the ROM.
Because a global label starts a routine, a global label on a loop inside a routine splits that
routine in two. Give loops temporary labels ( `loop) or wrap the routine in .proc, and it stays
one row. Data after a routine counts toward its size, never toward its time.
The Addresses tab
The raw view: every instruction that ran, with its execution count and time, the routine it belongs to and its offset in it. It is the same information Fuse’s profiler writes.
The Call tree tab
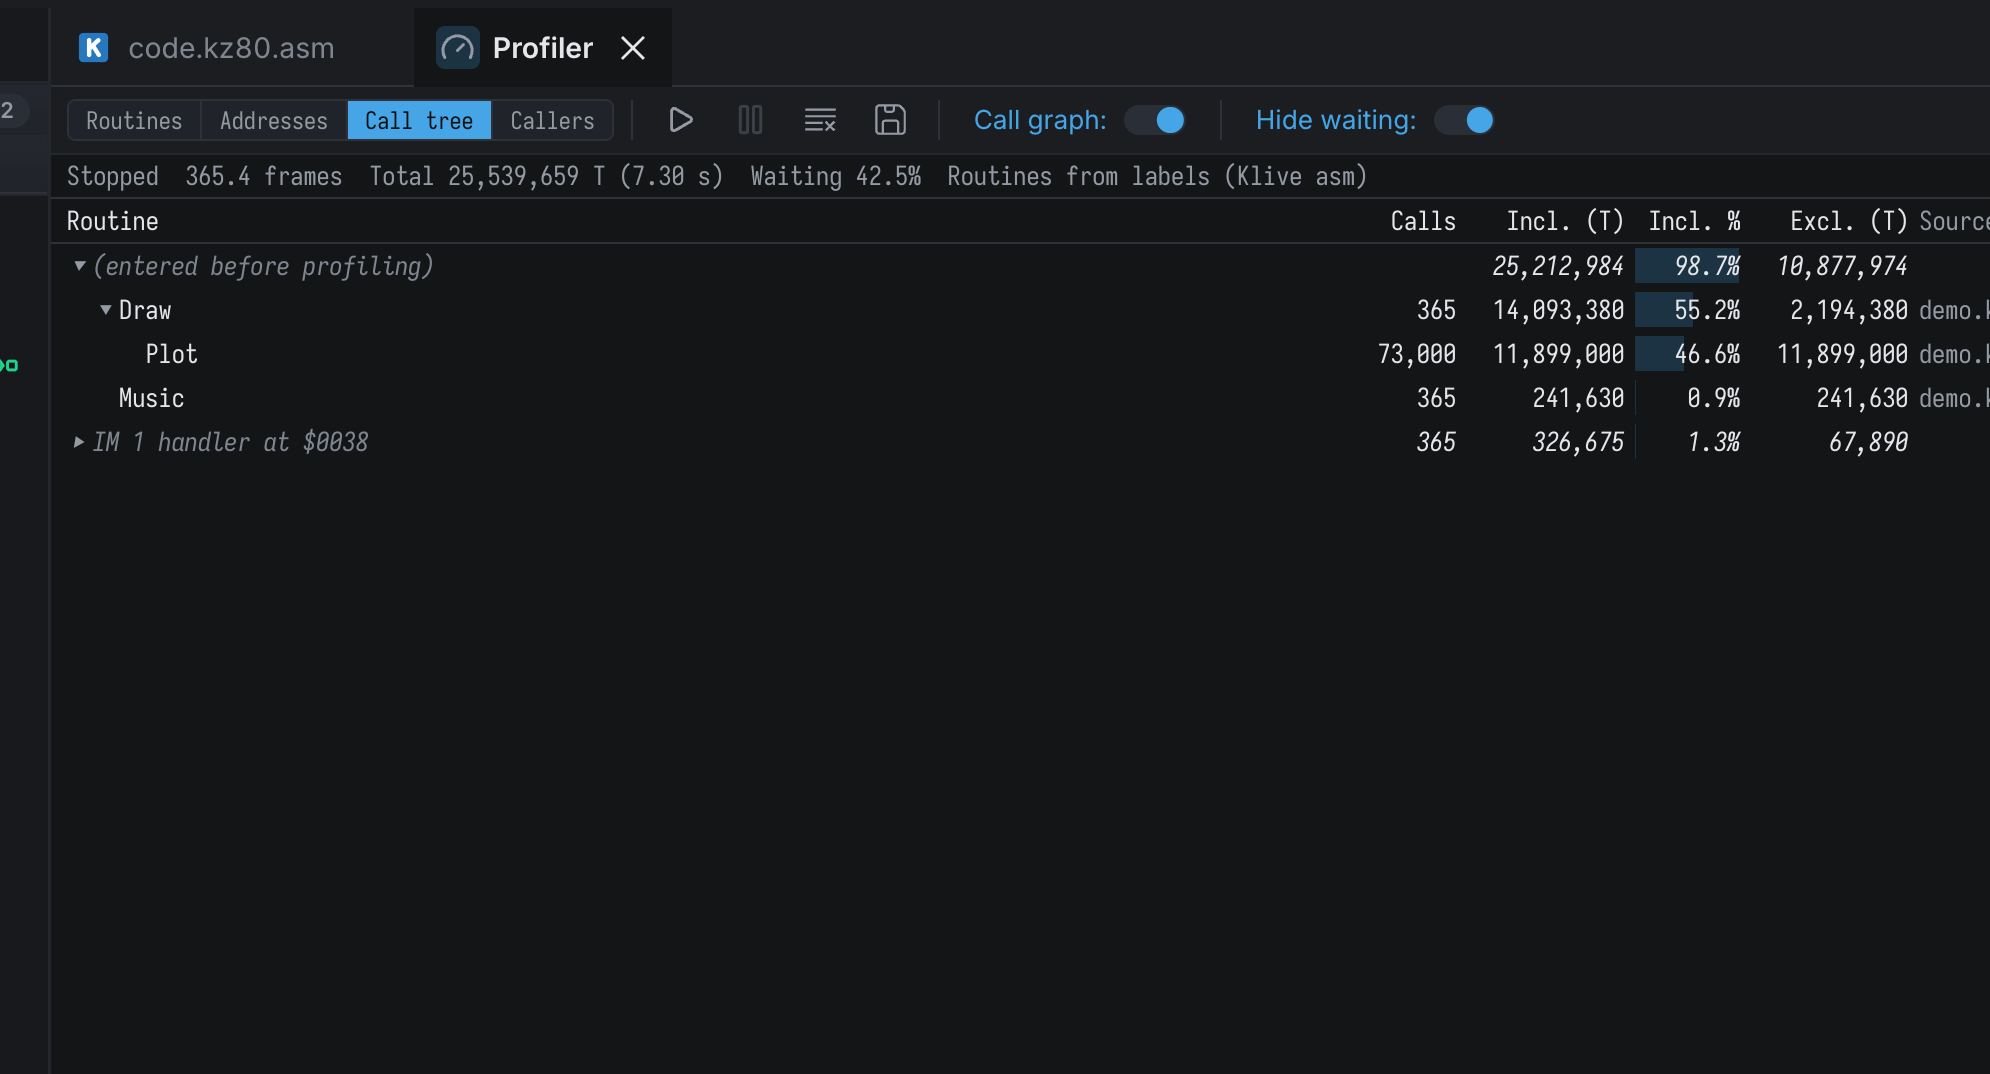
With the call graph recorded, the Call tree shows who called whom, top-down. Each row shows the calls made from its parent, their inclusive time (with everything they called) and their exclusive time (their own code only). Expand a row to see the routines it called.
The tree has more than one root:
- (entered before profiling) holds the code that ran outside every call the profiler saw - the routine that was already running when profiling started, and your main loop if it is not itself called.
- Each interrupt handler is a root of its own -
IM 1 handler at $0038,IM 2 → $FDFD (Music),NMI at $0066. Its time is not charged to whatever routine it happened to interrupt, so a music player driven by the frame interrupt shows up as the cost it is, instead of being smeared over the rest of the program.
A recursive call is shown once more, marked ↺, and not expanded further; its inclusive time is
counted at the outermost call only.
The Callers tab
Select a routine in the Routines or Call tree tab, then open Callers to see who called it, how often, and how much time those calls took - and, below, the routines it called itself.
How calls are tracked
The profiler follows CALL, RST, interrupts and every RET/RETI/RETN with a shadow stack. Z80
programs play tricks with the stack, and the profiler is built to stay robust rather than to guess:
- A
RETcloses every call whose return address it climbed past. That handles a normal return, an error handler that unwinds several levels at once (the 48K ROM’sRST 8), and a routine that dropped its return address and jumped away. PUSH HL/RETused as a computed jump is a jump, not a return.- A tail call (
JPto another routine instead ofCALLandRET) charges the jumped-to code to the caller, as every stack-based profiler does. The Routines and Addresses tabs still show the truth, because they measure each instruction where it is. - When the stack pointer jumps far (
LD SPto another stack), the profiler starts the call stack again from the root. The header then says how many stack switches it saw: the call graph is approximate around them. It also reports calls nested deeper than 256 levels, and calls it had to count under (other) when its table of caller/callee pairs was full.
In the editor
Turn on Settings › Debugging › Profile hints in the editor to see each routine’s share and calls at the end of its first line while a profile is present:
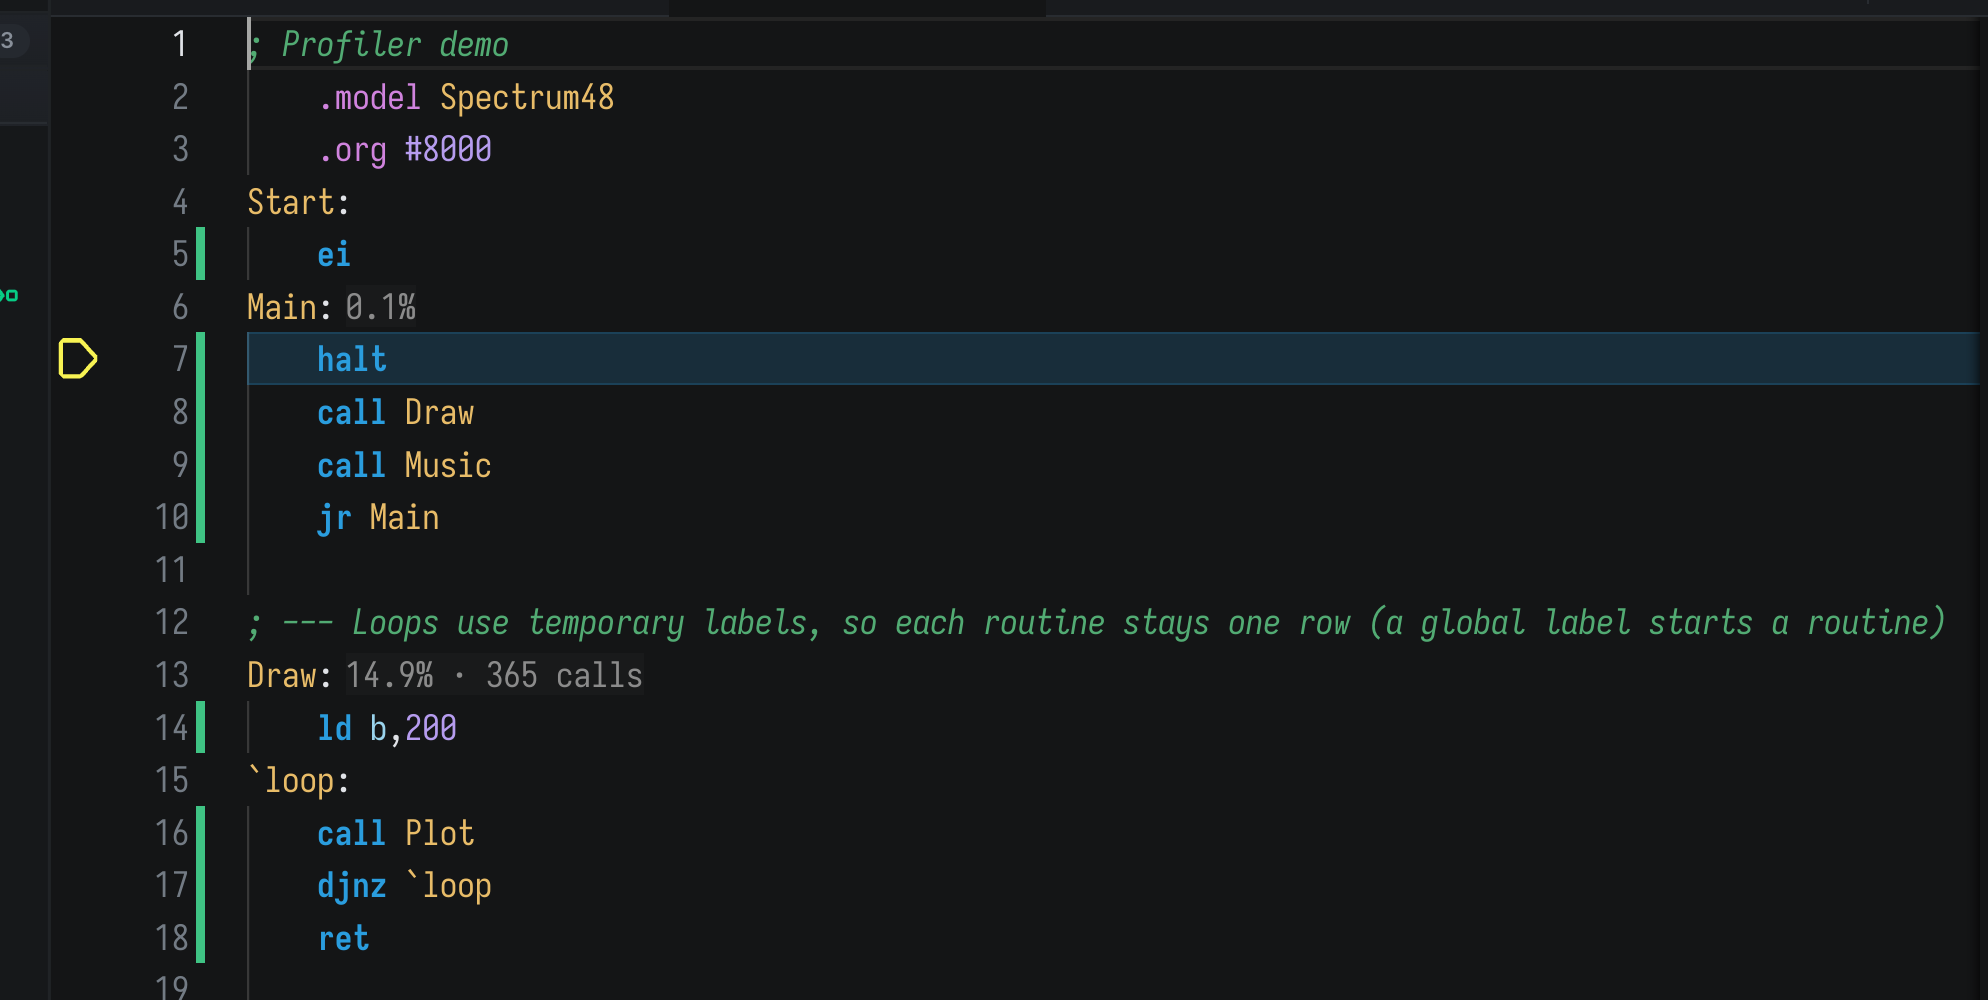
With a profile present, the disassembly’s coverage cell tooltip also shows each instruction’s share of the profiled time.
Exporting a profile
Use the document’s Export button, or the command:
profile export <file> [-format fuse|csv|callgrind|speedscope] [-addresses] [-f]The format follows the file name unless -format names one:
| File | Format | Open it with |
|---|---|---|
*.json | speedscope’s sampled profile | speedscope.app or its offline viewer: a flame graph of the call graph |
callgrind.out.*, *.callgrind | Callgrind | KCachegrind or QCachegrind |
*.csv | The Routines table (or, with -addresses, the Addresses table) | A spreadsheet |
*.prof | Fuse’s profile: 0xADDR,TSTATES per address | Existing scripts and profile2map |
speedscope and callgrind need the call graph. The call graph records which routine called which, not every full call path, so below the first level a flame graph splits a routine’s calls among its callers in proportion to the time each spent in it.
Commands
| Command | Does |
|---|---|
profile start [-calls] [-at <addr>] [-until <addr>] (pst) | Reset and start a window; -calls records the call graph. |
profile stop (psp) | Stop the window; the profile stays. |
profile reset | Clear the profile. |
profile status | The window, the time, the frames, the call graph’s counters. |
profile top [n] [-by self|inclusive|calls] [-waiting] | The top routines as a text table in the output. |
profile export <file> ... | Export, as above. |
show-profiler (shprof), hide-profiler | Open or close the Profiler document. |
See the commands reference for the details.